Question 1e should read: What is the WAVELENGTH of light in Lallium.
Sorry for the confusion.
Wednesday, December 18, 2013
Wednesday, December 11, 2013

Friday, December 6, 2013
Getting started on the lab
To remind you:
After you have done both the lens and mirror parts of the lab, start to look at your data for trends:
Is there a point where images go from bigger to smaller, real to virtual, etc.? Is this related to the approximate focal length (measured at the beginning of the trials? Start to think and write about this. Hint - there IS something to be seen, even if it's tough to tell from your data.
Check out this applet:
http://www.physics.metu.edu.tr/~bucurgat/ntnujava/Lens/lens_e.html
Move the object (arrow) and note what happens to the image. Think about this as it relates to your lab.
Now - calculate experimental focal lengths with your data (for convex lenses and concave mirrors), using the mirror/lens equation. Are these close to the approximate f (from outside)? Start thinking about sources of error.
Your lab will have the following:
- data
- discussion of trends seen
- calculation of f -- show a sample calculation (don't show ALL calculations, though all f's need to be calculated)
- sources of error
- general conclusion
Be sure to talk about how different your calculated f's are from the approximate f that you got from focusing on something outside.
A couple questions to answer:
1. How could one possibly determine the focal length of a convex mirror or concave lens? Is it possible to experimentally determine?
2. What should happen if you cover up part (or most) of the lens or mirror? Do you still get images? How are they affected?
Wednesday, December 4, 2013
Important
Please bring your physics notebook/notes/laptop to the next class -- I want to do a notes check while you take the quiz. Thanks!
I'm NOT grading the notebook - I just want to get a sense of how (or if.....) you take notes.
I'm NOT grading the notebook - I just want to get a sense of how (or if.....) you take notes.
Tuesday, December 3, 2013
Stuff for next class
Quiz (E): Thursday
Quiz (A): Friday
Quiz is on: Snell's law, index of refraction, etc. Possible question about focal length. Possible practical part.
After you have done both the lens and mirror parts of the lab, start to look at your data for trends:
Is there a point where images go from bigger to smaller, real to virtual, etc.? Is this related to the approximate focal length (measured at the beginning of the trials? Start to think and write about this. Hint - there IS something to be seen, even if it's tough to tell from your data.
Check out this applet:
http://www.physics.metu.edu.tr/~bucurgat/ntnujava/Lens/lens_e.html
Move the object (arrow) and note what happens to the image. Think about this as it relates to your lab.
If you have time, start to calculate experimental focal lengths with your data (for convex lenses and concave mirrors), using the mirror/lens equation. Are these close to the approximate f (from outside)? Start thinking about sources of error.
Monday, December 2, 2013
quiz
A - quiz Friday
E - quiz Thursday
Topics:
Snell's law
- be able to use it (in all its forms) to find: n, angle, wavelength, speed of wave
Index of refraction
focal length
There *may* be a practical component to the quiz.
E - quiz Thursday
Topics:
Snell's law
- be able to use it (in all its forms) to find: n, angle, wavelength, speed of wave
Index of refraction
focal length
There *may* be a practical component to the quiz.
Tuesday, November 26, 2013
Lab notes
How does the object location affect the formation of images,
in terms of:
-
Whether or not an image forms
-
Whether the image is “real” or “virtual”
-
Whether the image is larger, smaller, or the
same size as the object
-
Whether the image is upside-down or right-side
up
-
Where the image is located
First, find an approximate “focal length” (f), using the
technique described in class – focusing on a bright object outside, bringing an
image onto a screen.
Then, data collection begins. Do the convex lens first.
In this lab, move the object (candle) around
methodically. Note the following in a
table:
do object
distance from lens
di image
distance from lens
U/D up or down
R/V real or
virtual
Size size change
Repeat for a concave lens.
Monday, November 25, 2013
Pre-Lab
As you saw in class, convex and concave lenses behave in different ways. In our new formal lab, you will determine exactly how this happens.
Prior to this, research this question - what exactly is a focal point, and how is it different for a convex lens vs. a concave lens.
In the lab, you will be moving an object (candle) and seeing how images form (if indeed they do) - are they larger/smaller/same, real/virtual (look this up, too), upside-down or right-side up.
Thursday, November 21, 2013
HW
E -- do as earlier listed
A -- Problems to try:
Light passes from air to a block of new stuff, with the angle going from 60 degrees outside the block to 35 degrees inside the block. The angles are measured with respect to a normal (perpendicular) line.
a. Draw this.
b. Calculate the index of refraction of the stuff.
A -- Problems to try:
Light passes from air to a block of new stuff, with the angle going from 60 degrees outside the block to 35 degrees inside the block. The angles are measured with respect to a normal (perpendicular) line.
a. Draw this.
b. Calculate the index of refraction of the stuff.
c. Find the critical angle of this stuff.
Wednesday, November 20, 2013
Applet to play with / HW
http://stwww.weizmann.ac.il/lasers/laserweb/java/twoangles2.htm
Also (E block) -- calculate the index of refraction from today's experiment. Look up the value of n for water (or salt water).
Play with the applet, too.
And if you're really, really bored:
http://www.slate.com/articles/arts/culturebox/2013/11/where_s_waldo_a_new_strategy_for_locating_the_missing_man_in_martin_hanford.html
Tuesday, November 19, 2013
Doctor Whoooooooo?
http://geekdad.com/2013/11/doctor-timeline-fifty-years-glance/
Purely for Doctor Who fans. For the rest of you - sorry.
Purely for Doctor Who fans. For the rest of you - sorry.
HW
E block - When last we met, we were chatting about total internal reflection. Use Snell's law to derive an expression for the critical angle of a material. Assume that light comes from inside the material (say, water, though you can just call it n1) and goes to air (n2 = 1). This will be a simple expression.
E and A:
Read about fiber optics and see how is is related to total internal reflection.
Find out how you get your phone/cable/internet service in your home (if you get it).
Problems:
1. What is the critical angle of a material with index of refraction 1.6?
2. Can you make a general expression for critical angle, one that represents light traveling between any two mediums? That is, assume that the new medium is NOT air, but rather some stuff with index n2.
Thursday, November 14, 2013
Snell's Law homework
1. Review the derivation.
2. Solve these problems:
A. What is the index of refraction for a material in which light is slowed to half its speed in a vacuum?
B. Water has an index of refraction of 1.33. What is the speed of light in water? (Water you waiting for?)
C. Light passes from air to a piece of plastic, with an initial angle of 50 degrees and refracted angle of 30 degrees. What is the index of refraction of this plastic?
D, A material has an index of refraction of 1.7. Light is refracted at an angle of 44 degrees inside the material. What was the original angle outside the material?


Wednesday, November 13, 2013
HW
Look up two things:
index of refraction
Snell's law (of refraction)
Both will have equations associated with the definitions. Figure out what you can.
If you're feeling ambitious, look for a derivation of Snell's law. You may not be able to follow it, and that's quite ok; however, if it's the geometry version, which we'll cover next class, you may want a heads-up on it.
Friday, November 1, 2013
practice pre-test problems.
Remember: Proper prior preparation prevents poor performance.
1. B is 466.1 Hz, approximately. Find the following frequencies:
a. the next 2 octaves
b. the 2 octaves below
c. the C above (one semi-tone)
d. the D above (3 semi-tones)
2. Write your own Doppler effect problem and solve it - be sure to have a few different conditions.
3. Consider a tube open on both ends, 0.4-m in length. Find the relevant stuff for the first 3 harmonics: wavelengths, frequencies, shapes. Repeat for the same tube open on one end only.
4. Graph the following: y = 3cos(2x) - 5sin(3x). Find the y value at x = 75 degrees.
5. Review the speed of sound lab in your notes.
Wednesday, October 30, 2013
HW
Find an expression for the Doppler effect for sound - something that allows one to predict the new frequency (or Doppler shift) based on speeds of moving objects and detectors.
Friday, October 25, 2013
Organ Pipes and Standing Waves
http://www.physics.smu.edu/~olness/www/05fall1320/applet/pipe-waves.html
Play with the applet above, observing the wave with the tube open on both ends. Then try one end open only.
Increase the number of harmonics and note how the wave shape changes.
This is important - the air molecules move as depicted in the animation on top. The animation below represents graphs of air molecule motion (displacement) or pressure (if you click on that button).
Try these problems (E block, for Tuesday. A block can hold off on trying these until after Monday's class.)
1. A tube is open on both ends (as shown in class). Assume that the speed of sound is 340 m/s. The tube length is 0.5-m. Find the following:
a. the wavelength of the n=1 harmonic (lowest harmonic that fits in the tube)
b. the frequency of this harmonic
c. the frequency of the next 2 harmonics above n=1. Assume that it basically works like a guitar string.
2. If you wish a tube to vibrate at concert A (440 Hz), how long should it be?
That's it. Sorry again (E block) that we started late today.
Thursday, October 24, 2013
Clara Rockmore / theremin
http://www.youtube.com/watch?v=pSzTPGlNa5U
http://www.youtube.com/watch?v=b5cOdZh4zK8
http://www.youtube.com/watch?v=Bm-rnbupIjk
>
http://www.youtube.com/watch?v=QSLMWasU0rM
The Beach Boys with a "tannerin" -- sounds like a theremin, but is easier to play.
http://www.youtube.com/watch?v=b5cOdZh4zK8
http://www.youtube.com/watch?v=Bm-rnbupIjk
>
http://www.youtube.com/watch?v=QSLMWasU0rM
The Beach Boys with a "tannerin" -- sounds like a theremin, but is easier to play.
Tuesday, October 22, 2013
just cool.
http://www.slate.com/blogs/bad_astronomy/2013/10/21/three_illusions_that_will_destroy_your_brain.html
Monday, October 21, 2013
Wave practice pre-quiz
1. Consider a string, 0.2-m long. The fundamental frequency of this string is 40 Hz.
a. Draw the first 3 harmonics.
b. Calculate the wavelengths, frequencies and speeds of the harmonics.
2. What is the wavelength of an 89.7 MHz radio wave? (This problem has been edited to change frequency to wavelength.)
3. Draw the resulting wave: y = 2 sin x + 3 cos x. Also, give the exact value of y when x = 90 degrees.
4. Consider a triangle with sides: 33, 56, 65. Find the values of the angles.
5. What is the period of a 1.3-m long pendulum on Earth? On the Moon?
All formulas will be given in this quiz - no need to memorize: SOH CAH TOA, v = f l, l = 2L/n, c = 3E8 m/s
Friday, October 18, 2013
Sine wave fun
A block - quiz next Thursday.
E block - quiz next Wednesday
http://my.hrw.com/math06_07/nsmedia/tools/Graph_Calculator/graphCalc.html
This is the grapher used in class.
Also useful:
http://surendranath.tripod.com/Applets/Waves/TWave02/TW02.html
http://www.colorado.edu/physics/2000/applets/fourier.html
http://www.walter-fendt.de/ph14e/stwaverefl.htm
Just cool:
http://www.acs.psu.edu/drussell/Demos/TuningFork/fork-modes.html
https://www.youtube.com/watch?v=aWAjLOwOHU0
Tuesday, October 15, 2013
Beside the homework - stuff FYI (links from class, etc.)
http://www.youtube.com/watch?v=XKRj-T4l-e8
Glass harp guy
http://www.youtube.com/watch?v=cPALfz-6pnQ
Shattering glass with sound
http://www.alaska.net/~clund/e_djublonskopf/Flatearthsociety.htm
Whaaaaaa?????
Glass harp guy
http://www.youtube.com/watch?v=cPALfz-6pnQ
Shattering glass with sound
http://www.alaska.net/~clund/e_djublonskopf/Flatearthsociety.htm
Whaaaaaa?????
Monday, October 14, 2013
HW for Wednesday (A) and Thursday (E)
Be sure that you are in DEGREES mode on your calculator.
1. Revisit the Moon Problem. If the diameter of the Moon is 1/4 the diameter of the Earth (look it up), and the angle subtended by the Moon is 0.5 degrees, how far away should the Moon be from Earth?
2. Consider a 3-4-5 triangle. Find the values of the angles in the triangle.
3. This one may be trickier. Make a graph of y = sin x, for values from 0 to 360 degrees. You could do this on your calculator, but make sure that you could also do it "by hand" - choosing several x values (30, 45, 60, 90, 120, 135 degrees, etc.) and plotting them on an axis. Graph paper may actually be best for this.
4. Repeat 3 for y = cos x.
5. How would the graphs for 3 or 4 above differ if there were coefficients? Say, y = 3x. How would the graph change? (This is an amplitude change.)
6. How would the graph change in this case: y = sin(2x)
Wednesday, October 9, 2013
Lab Guidelines
Your first formal lab will be due in 3 classes. If you want me to have a quick look at it, show it to me within 2 classes.
The lab writeup should have each of the following items:
Title of Experiment - this is up to you
Your name
Lab partner(s)
Date(s) performed
Purpose - the purpose of the experiment, as it appears to you
Data - in table form, with units. Give table a title as well.
Graph(s), where relevant - for this harmonic lab, graphs are optional. They may make your point(s) stronger.
Answers to lab questions - see lab handout
Sources of error and ways to eliminate/reduce error
General conclusion - Talk about what you learned in the experiment. Analyze data. Give thoughts and reasoning, where appropriate. Talk about applications or places where this new knowledge applies.
It's not that different from the first lab - just a couple of extra things. Make sure it is neat.
Tuesday, October 8, 2013
Waves - part 1
There are 2 primary categories of waves:
Mechanical – these require a medium (e.g., sound, guitar strings, water, etc.)
Electromagnetic – these do NOT require a medium and, in fact, travel fastest where is there is nothing in the way (a vacuum). All e/m waves travel at the same speed in a vacuum (c, the speed of light)
General breakdown of e/m waves from low frequency (and long wavelength) to high frequency (and short wavelength):
Radio
Microwave
IR (infrared)
Visible (ROYGBV)
UV (ultraviolet)
X-rays
Gamma rays
In detail, particularly the last image:
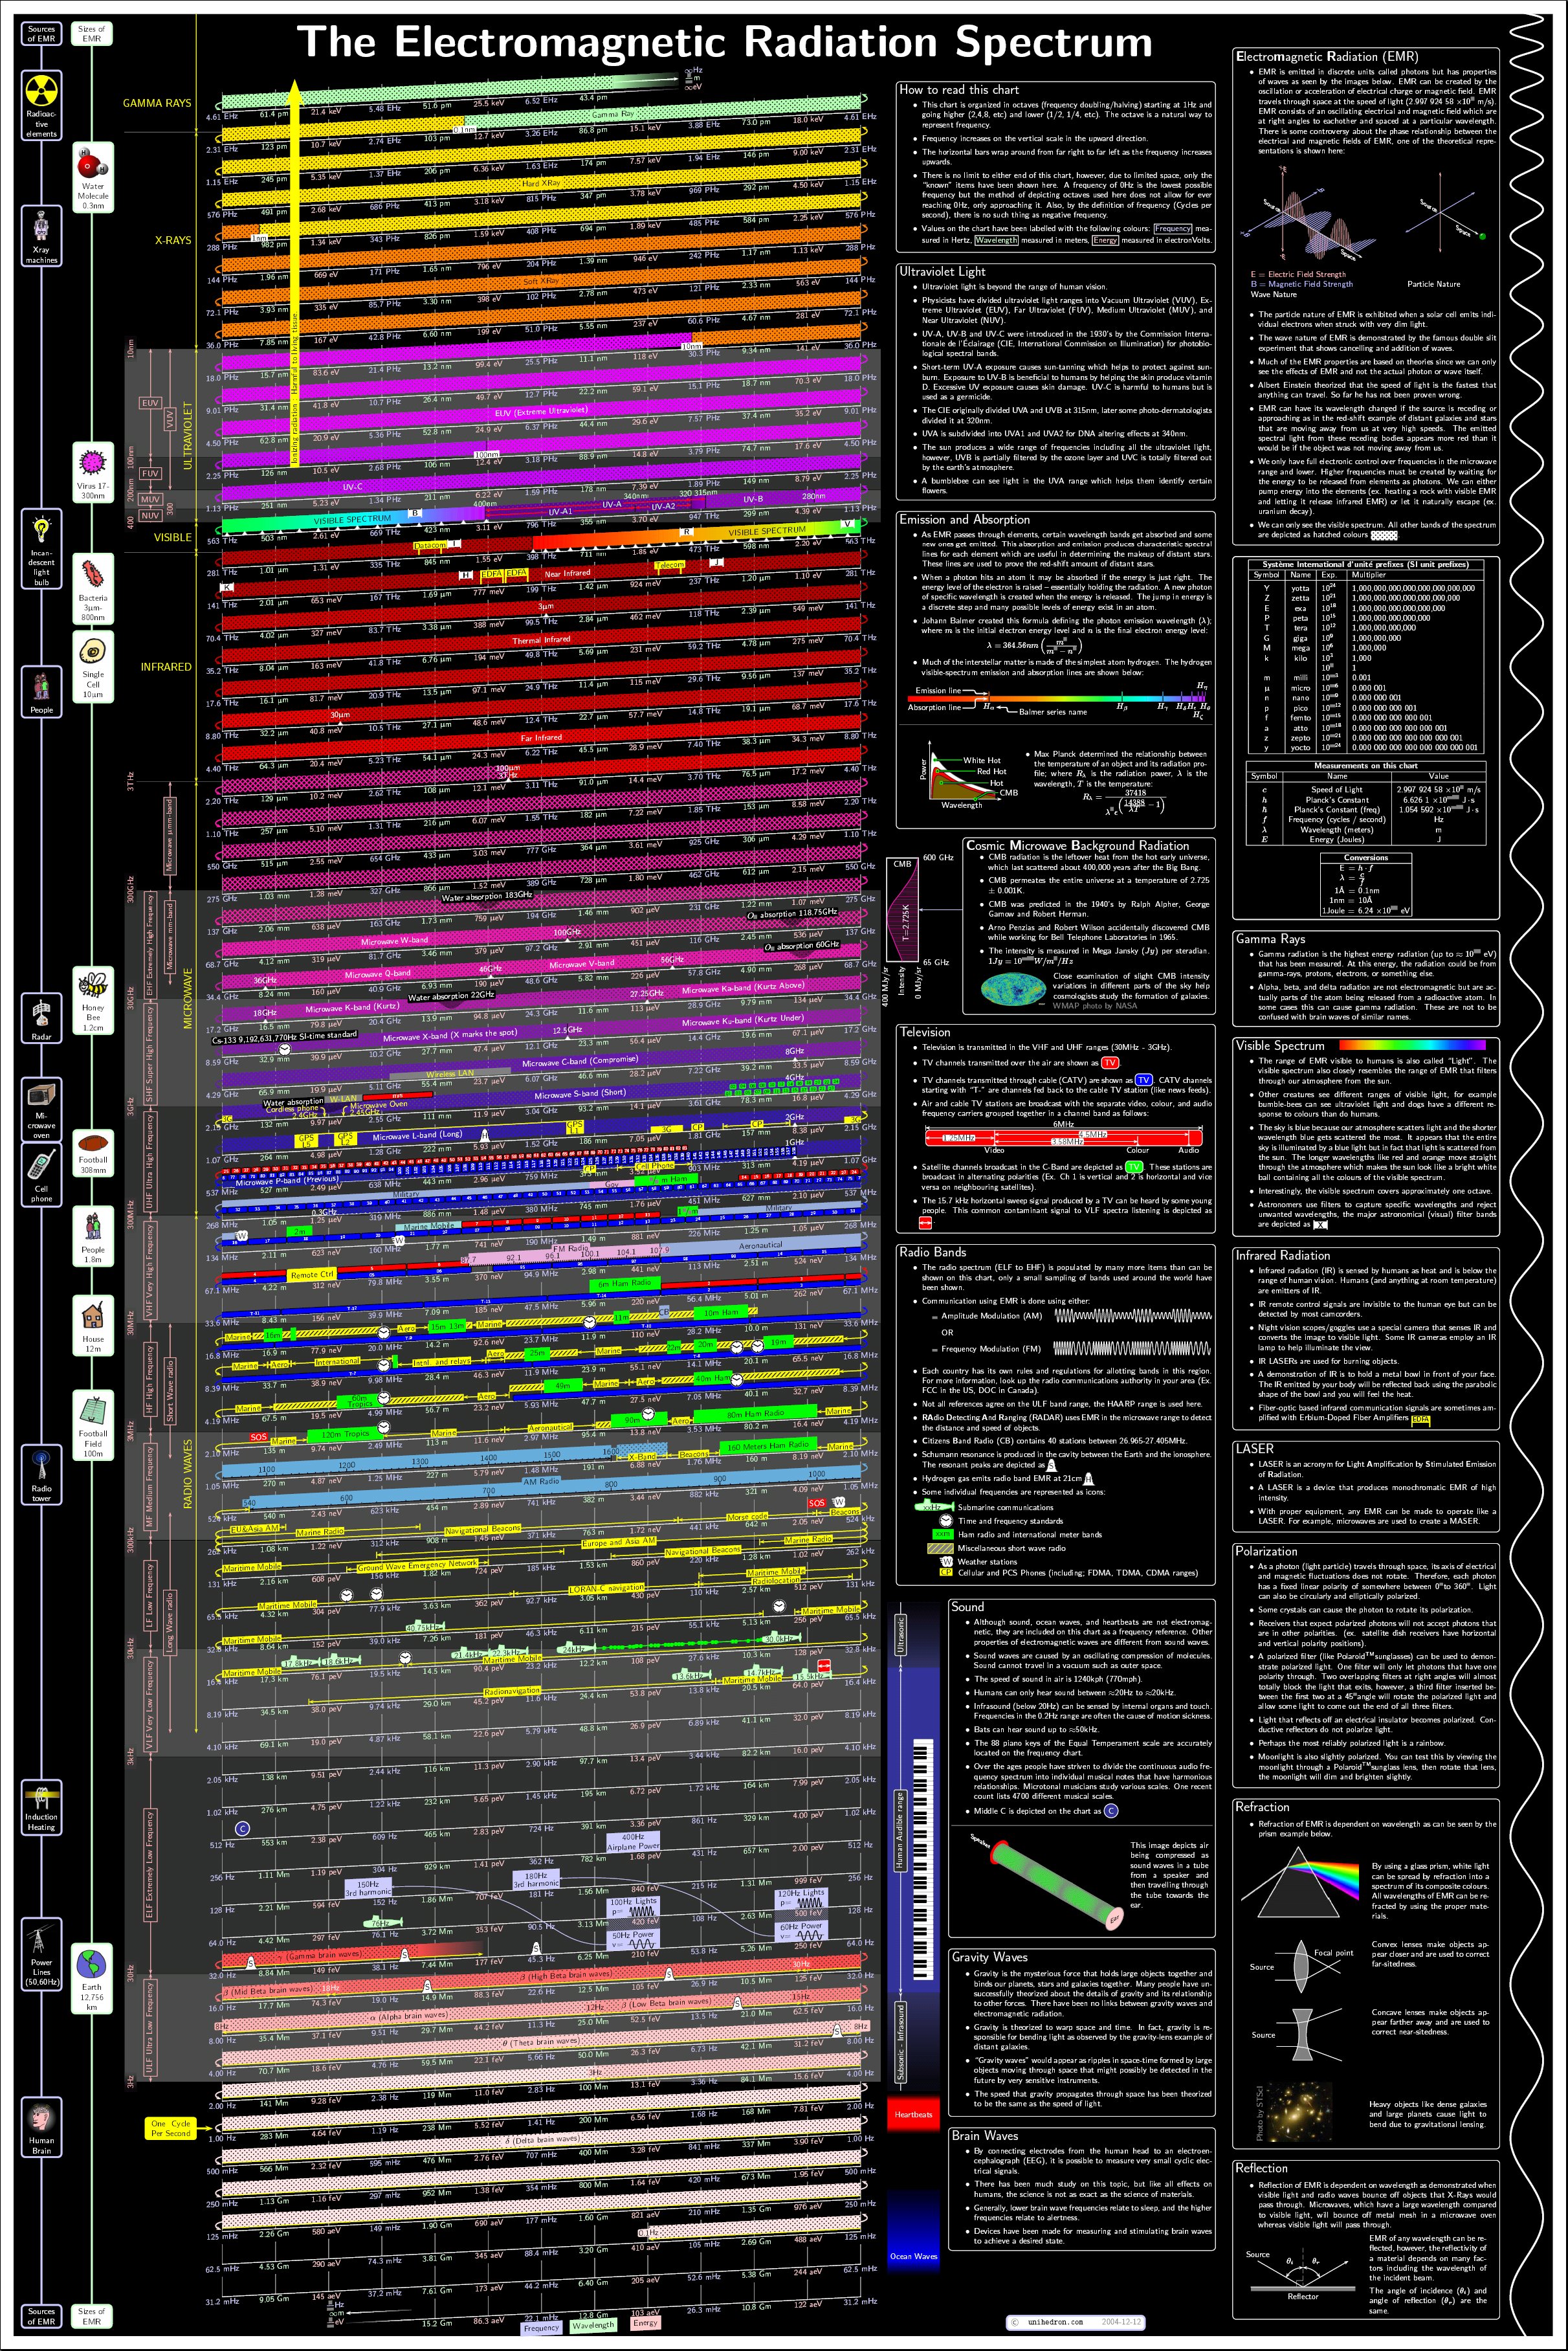
Waves have several characteristics associated with them, most notably: wavelength, frequency, speed. These variables are related by the expression:
v = f l
speed = frequency x wavelength
(Note that the 'l' above should be the Greek letter 'lambda'.)
(Note that the 'l' above should be the Greek letter 'lambda'.)
For e/m waves, the speed is the speed of light, so the expression becomes:
c = f l
Again, the 'l' should be Greek letter 'lambda'.
Note that for a given medium (constant speed), as the frequency increases, the wavelength decreases.
Note the units:
Frequency is in hertz (Hz), also known as a cycle per second.
Wavelength is in meters or some unit of length.
Speed is typically in meters/second (m/s) or cm/s.
Sound waves
In music, the concept of “octave” is defined as doubling the frequency. For example, a concert A is defined as 440 Hz. The next A on the piano would have a frequency of 880 Hz. The A after that? 1760 Hz. The A below concert A? 220 Hz. Finding the other notes that exist is trickier and we’ll get to that later.
Interference
Interference
Waves can “interfere” with each other – run into each other. This is true for both mechanical and e/m waves, but it is easiest to visualize with mechanical waves. When this happens, they instantaneously “add”, producing a new wave. This new wave may be bigger, smaller or simply the mathematical sum of the 2 (or more) waves. For example, 2 identical sine waves add to produce a new sine wave that is twice as tall as one alone (as in, 1 sin x + 2 sin x = 3 sin x). Most cases are more complicated (1 sin x + 3 cos x = .....).
In music, waves can add nicely to produce chords, as long as the frequencies are in particular ratios. For example, a major chord is produced when a note is played simultaneously with 2 other notes of ratios 5/4 and 3/2. (In a C chord, that requires the C, E and G to be played simultaneously.) Of course, there are many types of chords (major, minor, 7ths, 6ths,…..) but all have similar rules. In general, musicians don’t remember the ratios, but remember that a major chord is made from the 1 (DO), the 3 (MI) and the 5 (SO). It gets complicated pretty quickly.
We looked at specific cases of waves interfering with each other – the case of “standing waves” or “harmonics.” Here we see that certain frequencies produce larger amplitudes than other frequencies. There is a lowest possible frequency (the resonant frequency) that gives a “half wave” or “single hump”. Every other harmonic has a frequency that is an integer multiple of the resonant frequency. So, if the lowest frequency is 25 Hz, the next harmonic will be found at 50 Hz – note that that is 1 octave higher than 25 Hz. Guitar players find this by hitting the 12th fret on the neck of the guitar. The next harmonics in this series are at 75 Hz, 100 Hz and so on. Or if you prefer, fn = n f1.
Friday, October 4, 2013
one more thing
If you haven't played around with this yet, do so:
http://phet.colorado.edu/sims/wave-on-a-string/wave-on-a-string_en.html
http://phet.colorado.edu/sims/wave-on-a-string/wave-on-a-string_en.html
Tuesday, October 1, 2013
Homework due after the retreat
1. Observe the image of "harmonics" from class below. Can you come up with an equation that represents/predicts the wavelength series, starting from the simplest/first wave?
2. Check out the electromagnetic spectrum chart. See if you can find out, doing some bits of research, where these devices reside in the spectrum: cell phones, garage door openers, sunlight, FM radio, AM radio, TV, any other waves of interest to you.
3. Define these words: harmonics, wave, radian

2. Check out the electromagnetic spectrum chart. See if you can find out, doing some bits of research, where these devices reside in the spectrum: cell phones, garage door openers, sunlight, FM radio, AM radio, TV, any other waves of interest to you.
3. Define these words: harmonics, wave, radian
Monday, September 30, 2013
Applet to play with.
In addition to the problems THAT WILL BE TURNED IN NEXT CLASS, play around with this applet:
http://phet.colorado.edu/sims/wave-on-a-string/wave-on-a-string_en.html
Physics - yay!
http://phet.colorado.edu/sims/wave-on-a-string/wave-on-a-string_en.html
Physics - yay!
Friday, September 27, 2013
Homework to be turned in on Tuesday (A block) and Wednesday (E block)
Note - this is due on Tuesday for A block, and Wednesday for E block (who already have a different assignment due for Monday).
Write your answers on a separate sheet of paper TO BE TURNED IN.
Please write your work and answers on a sheet of paper that you can turn in. Thanks!
1. What is the wavelength of a 120 pm x-ray? (pm means 10^-12 m and x-rays travel at the speed of light)
2. Draw the approximate shape of a graph of period vs. length for a pendulum.
3. The equation we've seen in class is the period of a "simple" pendulum. What do you suppose makes our pendulums "simple"?
4. Calculate the period of a 5-m long pendulum.
5. If the pendulum in #4 above were taken to Mars, where the gravity is roughly 40% Earth's gravity, would be the new period?
6. Consider a 261.6 Hz sound wave (this is approximately the note 'middle C'). Assume that the speed of sound at sea level is 340 m/s.
a. What is the wavelength of this sound wave?
b. Do you think the wavelength of this sound wave would be different on the Moon? How so?
c. Would the wavelength be different at a higher altitude, maybe in Boulder, Colorado? How so?
Wednesday, September 25, 2013
Homework
Due Friday for the A block class.
Due Monday for E, though you don't have to do number 1.
1. On the image below, try to use the equations to derive the wave speed equation.
2. Using this new equation, solve:
A. What is the wavelength of a concert A (440 Hz), if the speed of sound is 340 m/s?
B. What is the wavelength of a radio signal (89.7 MHz). It travels at the speed of light.
Thursday, September 19, 2013
Lab HW
You will be submitting an informal lab report for your pendulum work - this will be submitted individually, 2 classes from now.
In it, you should have:
Graph of Time vs. Length, with a curve fit
Graph of Time vs. Square root of length, with a linear regression line (and slope)
Graph of Time vs. Angle (if you took that data)
On the second graph, the regression line equation IS the equation for your experiment. Write down that equation and talk (in a conclusion) about how well it compares to the ACTUAL equation for the period/time of a pendulum:

Note that g is a local gravitation constant, equal to around 9.8 m/s/s (that's how quickly gravity makes object accelerate, in m/s per second). If you work out the constants (2 pi divided by the square root of 9.8), you get a coefficient of around 2.0. So a local version of the equation becomes:
T = 2 sqrt (L)
In your conclusion (which will be 2-3 paragraphs at minimum), discuss:
- the extent to which your equation resembles the one above
- sources of error in your experiment
- ways to improve your experiment
- anything else you wish to talk about
And answer these two mathematical questions:
1. What is the period of a 4-m long pendulum?
2. What is the length of a pendulum with a 1-s period?
Again, here's what is due in 2 classes:
Graphs
Conclusion
Answers to the mathematical questions above.
And it should be neat - typed is nice, but handwritten is ok, too.
In it, you should have:
Graph of Time vs. Length, with a curve fit
Graph of Time vs. Square root of length, with a linear regression line (and slope)
Graph of Time vs. Angle (if you took that data)
On the second graph, the regression line equation IS the equation for your experiment. Write down that equation and talk (in a conclusion) about how well it compares to the ACTUAL equation for the period/time of a pendulum:
Note that g is a local gravitation constant, equal to around 9.8 m/s/s (that's how quickly gravity makes object accelerate, in m/s per second). If you work out the constants (2 pi divided by the square root of 9.8), you get a coefficient of around 2.0. So a local version of the equation becomes:
T = 2 sqrt (L)
In your conclusion (which will be 2-3 paragraphs at minimum), discuss:
- the extent to which your equation resembles the one above
- sources of error in your experiment
- ways to improve your experiment
- anything else you wish to talk about
And answer these two mathematical questions:
1. What is the period of a 4-m long pendulum?
2. What is the length of a pendulum with a 1-s period?
Again, here's what is due in 2 classes:
Graphs
Conclusion
Answers to the mathematical questions above.
And it should be neat - typed is nice, but handwritten is ok, too.
Tuesday, September 17, 2013
Logger Pro download
Logger Pro 3.8.6.1 with sample movies (Windows)
Password: extrapolate
Logger Pro 3.8.6.1 with sample movies (Mac OS X)
Password: extrapolate
Monday, September 16, 2013
hw after today's data-gathering
E-block
Plot a graph of period vs. length, ideally by computer.
Discuss any relationship that seems apparent.
A-block
This will be your homework after Tuesday's class.
Plot a graph of period vs. length, ideally by computer.
Discuss any relationship that seems apparent.
A-block
This will be your homework after Tuesday's class.
Friday, September 13, 2013
Relationship?
You now have some pendulum data. Examine it and decide which (if any) variables are relevant. You may find that some are more relevant than others - perhaps some have differences that can be explained by timing issues.
How will you get a relationship out of this data? What is the best way to formulate a "rule" for your data? How can you turn your data into a predictive tool? Would a graph be helpful?
Think about these questions and make a first attempt at formulating a rule or equation. Bring this to class.
How will you get a relationship out of this data? What is the best way to formulate a "rule" for your data? How can you turn your data into a predictive tool? Would a graph be helpful?
Think about these questions and make a first attempt at formulating a rule or equation. Bring this to class.
Tuesday, September 10, 2013
Lab prep
Our goal will be to determine a mathematical relationship that describes the motion of a pendulum - specifically, how the time (for a complete swing - the period) depends on particular variables. Ideally, we will have a relationship that has predictive ability - something that we can use to predict the period of any theoretical pendulum.
Think about what variables you would test to find out whether or not a pendulum's period is altered (and how)?
Think also about how many trials you may need to take, the range of values (for example, if we're talking about length - how short to how long?) and how you will represent your data (chart, graph, both?).
Finally, think about how you will determine a mathematical relationship from all of the data? Can a data set or graph give you an equation? How?
Monday, September 9, 2013
HW for students in Monday's class (after class) and AFTER Tuesday's class
http://www.youtube.com/watch?v=NwyeK36Gh-s
Watch as much as you can stand - comment on what makes it believable or NOT believable.
Also, our first lab begins next class. Think about the following question:
What is a mathematical relationship that predicts the motion (time) of a pendulum swing? How can we determine this? How can we know if our model/relationship/equation is "correct"?
We will spend the next 2-3 classes treating this problem.
https://www.youtube.com/watch?v=2MFAvH8m8aI&feature=player_embedded
If you ever have an hour to kill - the best documentary on pseudoscience ever.
Wednesday, September 4, 2013
What is pseudoscience?
What Is Pseudoscience?
Distinguishing between science and pseudoscience is problematic
By Michael Shermer
Climate deniers are accused of practicing pseudoscience, as are intelligent design creationists, astrologers, UFOlogists, parapsychologists, practitioners of alternative medicine, and often anyone who strays far from the scientific mainstream. The boundary problem between science and pseudoscience, in fact, is notoriously fraught with definitional disagreements because the categories are too broad and fuzzy on the edges, and the term “pseudoscience” is subject to adjectival abuse against any claim one happens to dislike for any reason. In his 2010 book Nonsense on Stilts (University of Chicago Press), philosopher of science Massimo Pigliucci concedes that there is “no litmus test,” because “the boundaries separating science, nonscience, and pseudoscience are much fuzzier and more permeable than Popper (or, for that matter, most scientists) would have us believe.”
It was Karl Popper who first identified what he called “the demarcation problem” of finding a criterion to distinguish between empirical science, such as the successful 1919 test of Einstein’s general theory of relativity, and pseudoscience, such as Freud’s theories, whose adherents sought only confirming evidence while ignoring disconfirming cases. Einstein’s theory might have been falsified had solar-eclipse data not shown the requisite deflection of starlight bent by the sun’s gravitational field. Freud’s theories, however, could never be disproved, because there was no testable hypothesis open to refutability. Thus, Popper famously declared “falsifiability” as the ultimate criterion of demarcation.
The problem is that many sciences are nonfalsifiable, such as string theory, the neuroscience surrounding consciousness, grand economic models and the extraterrestrial hypothesis. On the last, short of searching every planet around every star in every galaxy in the cosmos, can we ever say with certainty that E.T.s do not exist?
Princeton University historian of science Michael D. Gordin adds in his forthcoming book The Pseudoscience Wars (University of Chicago Press, 2012), “No one in the history of the world has ever self-identified as a pseudoscientist. There is no person who wakes up in the morning and thinks to himself, ‘I’ll just head into my pseudolaboratory and perform some pseudoexperiments to try to confirm my pseudotheories with pseudofacts.’” As Gordin documents with detailed examples, “individual scientists (as distinct from the monolithic ‘scientific community’) designate a doctrine a ‘pseudoscience’ only when they perceive themselves to be threatened—not necessarily by the new ideas themselves, but by what those ideas represent about the authority of science, science’s access to resources, or some other broader social trend. If one is not threatened, there is no need to lash out at the perceived pseudoscience; instead, one continues with one’s work and happily ignores the cranks.”
I call creationism “pseudoscience” not because its proponents are doing bad science—they are not doing science at all—but because they threaten science education in America, they breach the wall separating church and state, and they confuse the public about the nature of evolutionary theory and how science is conducted.
Here, perhaps, is a practical criterion for resolving the demarcation problem: the conduct of scientists as reflected in the pragmatic usefulness of an idea. That is, does the revolutionary new idea generate any interest on the part of working scientists for adoption in their research programs, produce any new lines of research, lead to any new discoveries, or influence any existing hypotheses, models, paradigms or worldviews? If not, chances are it is pseudoscience.
We can demarcate science from pseudoscience less by what science is and more by what scientists do. Science is a set of methods aimed at testing hypotheses and building theories. If a community of scientists actively adopts a new idea and if that idea then spreads through the field and is incorporated into research that produces useful knowledge reflected in presentations, publications, and especially new lines of inquiry and research, chances are it is science.
>
http://www.randi.org/site/index.php/encyclopedia.html
http://www.quackwatch.com/01QuackeryRelatedTopics/pseudo.html
http://en.wikipedia.org/wiki/Pseudoscience
http://www.skepdic.com/pseudosc.html
Subscribe to:
Posts (Atom)